

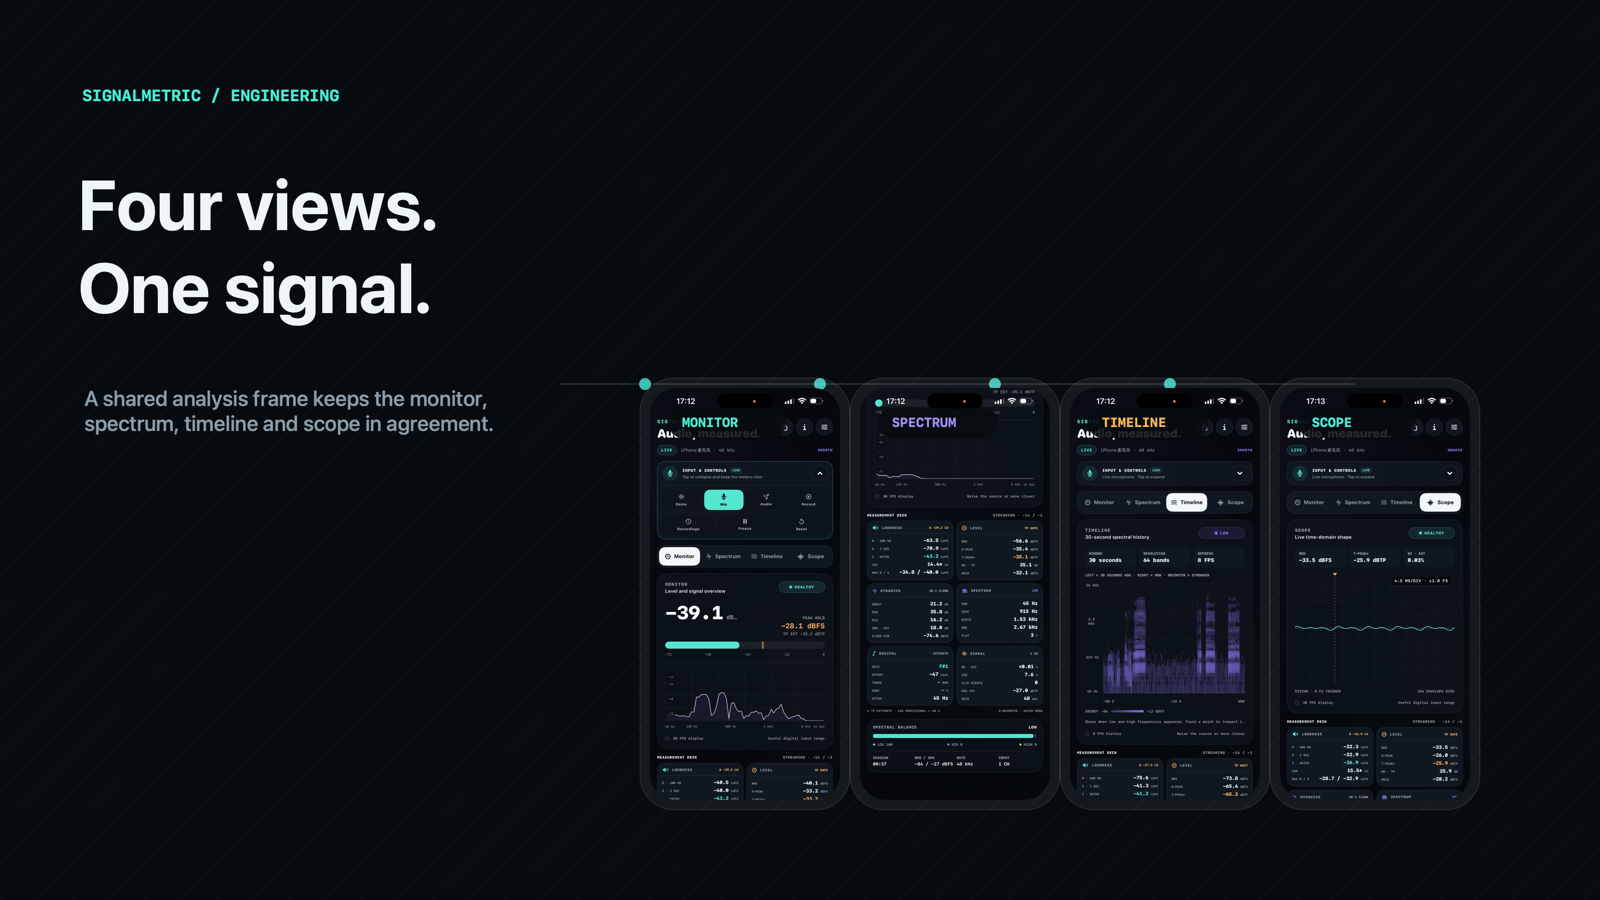
The difficult part of an audio analyzer is not drawing a moving line. The difficult part is making every moving line refer to the same signal, at the right time, without turning the audio callback into a UI scheduler or letting a slow screen create an ever-growing backlog.
SignalMetric began with one architectural decision: Monitor, Spectrum, Timeline, and Scope should be different readings of one analysis frame, not four partially independent instruments racing each other.
That decision shapes the whole path from AVAudioEngine to the screen.
Swipe horizontally to explore the diagram
This diagram could not be rendered. Its source is still available below.
View diagram source
flowchart LR
    A[Live microphone input] --> D[Audio capture]
    B[Imported or recorded file] --> C[AVAudioPlayerNode]
    C --> E[Main mixer tap]
    D --> F[2,048-sample capture window]
    E --> F
    F --> G[Serial ScopeAnalyzer]
    G --> H[Latest ScopeFrame]
    H --> I[30 FPS ViewModel publication]
    I --> J[Monitor]
    I --> K[Spectrum]
    I --> L[Timeline]
    I --> M[Scope]
    D --> N[Bounded recording writer]
The diagram looks conventional. The details are where a real-time tool either stays trustworthy or begins to drift.
One source path, even when the source changes
SignalMetric supports four source states: a permission-free demo signal, Live Mic, imported audio, and an explicit local recording. They do not all enter AVAudioEngine in the same place.
- A microphone session installs a tap on the input node.
- Imported or completed local files play through
AVAudioPlayerNode; analysis taps the main mixer so the analyzer sees the actual playback path. - Recording shares the microphone input tap with live analysis and copies accepted buffers to a file writer.
- Demo generates deterministic
ScopeFramevalues without asking for permission.
The important part is not that all sources use identical transport code. It is that a real audio source eventually reaches the same analyzer contract: a Float32 mono window, a sample rate, a route fingerprint, and a channel count.
For multi-channel input, the capture step folds the channels to an explicit mono analysis signal. That has a tradeoff: it makes the reported loudness and spectrum coherent with the product's mono measurement boundary, but it does not pretend to be a multichannel delivery meter. The UI carries channel-count context rather than hiding the fold-down.
When a route or sample rate changes, the analyzer resets its state and reconfigures its frequency-band ranges. Holding old loudness integration or FFT band definitions across a meaningful input change would make a clean-looking dashboard that is no longer describing one coherent session.
The render thread gets a bounded job
An AVAudioEngine tap is close to the audio render path. It should not wait for a view update, initiate network work, append unbounded history, or allocate a new session-sized buffer.
SignalMetric collects a fixed 2,048-sample analysis window. It keeps two preallocated sample slots: one can be under serial analysis while one waits to be processed. Once a full window is available, the capture path copies it into the available slot and schedules serial analysis. If a queued window is already pending, the app does not add another behind it. It skips that scheduling opportunity instead of creating latency debt.
That is a deliberate choice. A meter should show the newest useful evidence with bounded delay; it should not gradually become a display of several seconds ago because the UI had a brief stall.
Swipe horizontally to explore the diagram
This diagram could not be rendered. Its source is still available below.
View diagram source
sequenceDiagram
    participant Tap as Audio tap
    participant Capture as Fixed capture slots
    participant Analyzer as Serial analyzer
    participant Store as Latest-frame lock
    participant UI as Main actor at 30 FPS

    Tap->>Capture: Fill a 2,048-sample window
    alt No frame is pending
        Capture->>Analyzer: Schedule one window
        Analyzer->>Analyzer: FFT, levels, loudness, waveform
        Analyzer->>Store: Replace latest ScopeFrame
    else A frame is already pending
        Capture-->>Capture: Skip backlog growth
    end
    UI->>Store: Read latest available frame
    Store-->>UI: One coherent snapshot
    UI->>UI: Render four workspaces
The UI samples the most recent completed frame on the main actor at 30 FPS. It never receives an imperative push from the render callback. This separation gives the meter a stable presentation cadence even though the audio callback cadence depends on the device route and buffer timing.
The latest frame is protected by a lock and replaced as one value. A Monitor value therefore cannot belong to one FFT window while the Scope waveform belongs to another. The view may be one frame behind the analyzer, but it is internally consistent.
What belongs in a frame
The frame is more than a spectrum array. It is the boundary between signal processing and presentation. Its fields include:
- raw RMS dBFS, smoothed display level, instantaneous Sample Peak, held peak, and 4x True Peak estimate;
- K-weighted Momentary, Short-Term, Integrated loudness, and LRA;
- 24 visual bands and a 64-band logarithmic dBFS spectrum trace;
- peak-hold data, selected spectral components, centroid, bandwidth, 85% roll-off, and flatness;
- a triggered 256-bin waveform envelope;
- DC offset, zero-crossing rate, channel count, clip state, dominant frequency, and beat confidence;
- sample rate, source fingerprint, timestamp, and analysis-window duration.
It is tempting to put formatting, colors, and screen-specific rules into this model. We avoid that. The analyzer owns signal evidence. The view model owns presentation state such as formatted units, the selected workspace, accessible summaries, response preferences, session reset, and the bounded 30-second spectral history. This keeps a unit change or a screen redesign from quietly changing the measurement itself.
FFT is only one part of the work
The analyzer uses Accelerate/vDSP for a 2,048-point DFT after a Hanning window. A Hanning window reduces leakage, but it also means a high visible bin does not automatically represent a clean oscillator at exactly that bin's center frequency.
SignalMetric treats its strongest-component display as an inspection aid:
- It finds local maxima above absolute and relative floors.
- It suppresses candidates inside a resolvable Hanning main-lobe neighborhood so one component does not become several side-lobe cards.
- It refines a candidate with log-magnitude parabolic interpolation.
- It compensates displayed component amplitude for Hanning coherent gain.
- It adds a harmonic label only when at least two peaks support a common candidate fundamental within a stated tolerance.
- It matches and smooths displayed components at a lower publication cadence to avoid rank flicker.
This is why the Spectrum view can make a frequency observation legible without claiming that six sine waves reconstruct the complete source. The raw FFT resolution is still disclosed as sampleRate / 2048.
Level and loudness need the same restraint. RMS and Sample Peak are clamped to a practical digital range. True Peak is visibly called an estimate. Loudness uses persistent K-weighting filters and duration-weighted windows: 400 ms Momentary, 3 s Short-Term, 400 ms blocks with a 100 ms hop for Integrated loudness, plus absolute and relative gates. The meter follows BS.1770-style mono analysis terminology, not a claim of certified programme delivery compliance.
History must be bounded too
A good Timeline should feel continuous. It still needs a fixed memory budget.
SignalMetric publishes spectral history at eight frames per second. Thirty seconds produces at most 240 columns. The app stores the visual history as a bounded sequence rather than retaining every analysis frame from the beginning of a session.
The same rule applies to waveforms. The Scope is not a hidden full-resolution recording. It reduces the current analysis window to a fixed 256-bin min/max/average envelope after locating a rising zero-crossing trigger. Narrow transients remain represented in each bin instead of being silently lost in a simple average, while the display cost stays predictable.
Swipe horizontally to explore the diagram
This diagram could not be rendered. Its source is still available below.
View diagram source
flowchart TD
    A[Raw source frames] --> B[Fixed 2,048-sample analysis window]
    B --> C[64 log-band spectrum]
    C --> D[8 FPS history publisher]
    D --> E[240-column rolling timeline]
    B --> F[Triggered reduction]
    F --> G[256-bin waveform envelope]
    E --> H[Constant session memory]
    G --> H
The policy is not merely a performance optimization. A graph with unbounded history changes its behavior over time: memory pressure rises, rendering costs drift, and a long session starts to behave differently from a short one. An instrument should remain itself after an hour.
Recording is a second real-time responsibility
Recording adds disk I/O to an already time-sensitive input path. Sending the microphone's original AVAudioPCMBuffer directly to a slow writer would couple storage pressure to audio capture. SignalMetric instead copies each accepted buffer and writes it on a dedicated serial queue.
The queue is bounded to 64 pending recording buffers. If storage cannot keep up, recording stops rather than allowing memory to grow without limit. On Stop, interruption, route change, or backgrounding, the engine first rejects new recording buffers, then waits for already accepted writes to drain, and only then closes the local M4A file. The main thread does not block while this happens.
Swipe horizontally to explore the diagram
This diagram could not be rendered. Its source is still available below.
View diagram source
stateDiagram-v2
    [*] --> LiveAnalysis
    LiveAnalysis --> Recording: Tap Record
    Recording --> Finalizing: Stop / interruption / background
    Finalizing --> LocalFile: Accepted writes drain and M4A closes
    Finalizing --> Failed: Empty or failed file
    LocalFile --> FileAnalysis: Open local recording
    FileAnalysis --> LiveAnalysis: Switch source
This approach gives recording a visible, explicit state while leaving normal Live Mic analysis memory-only. The file is created only after the user taps Record. It remains local until the user chooses a share destination.
The limits are part of the design
The analyzer refuses a few seductive shortcuts:
- It does not call SwiftUI from the audio callback.
- It does not grow queues or history with session duration.
- It does not upload microphone or imported audio for processing.
- It does not paint uncalibrated microphone readings as SPL.
- It does not describe a 4x inter-sample estimate as a certification result.
- It does not force tempo or pitch values when confidence is weak.
Those constraints leave room for an instrument that stays responsive, explainable, and private. The result is not four unrelated visualizations. It is one source, one analysis boundary, and four ways to ask a better question.
For the user-facing view of those workspaces, see the SignalMetric product guide.